In the pharmaceutical industry, from a price and demand standpoint, all drugs are not created equal. In our daily practice with price elasticity, we find several instances in which drugs show a high level of demand variation whenever there is a change in price.
Price elasticity of demand (PED) quantifies how price changes affect the number of goods sold. In this post you can learn how to calculate price elasticity with real examples from the pharmaceutical industry. You can also see how to simulate the future demand of a medicine, according to variations in price, once the PED has been calculated.
This is the second in a series of three posts with the following topics about price elasticity:
1. Price Elasticity in Pharma: introduction
2. Calculating the price elasticity and predicting demand with examples from pharma
3. Demand Beyond a Medicine’s Price: Cross Elasticity of Demand
Price elasticity of demand (PED) calculates the percentage of change in quantity demanded, as a result of a percentage of change in price. In the formula we calculate the PED ratio, which is equal to the quantity demanded divided by the % change in price.
Mid-point formula
It is often safer, especially if the difference between quantities and prices is high, to use the mid-point formula for price elasticity.
Mid-point formula: Example of the life-saving patented drug
In the previous post, we explored the fictional example of a life-saving patented medicine. In this example, the pharmaceutical company raised the unit price of an essential medication from $100 to $150 (a 50% increase); as a result, demand decreased from 1,000 units to 950 units (a decrease of less than 5%).
Its P.E.D ratio would be: -0.12. As we said before, not very elastic.
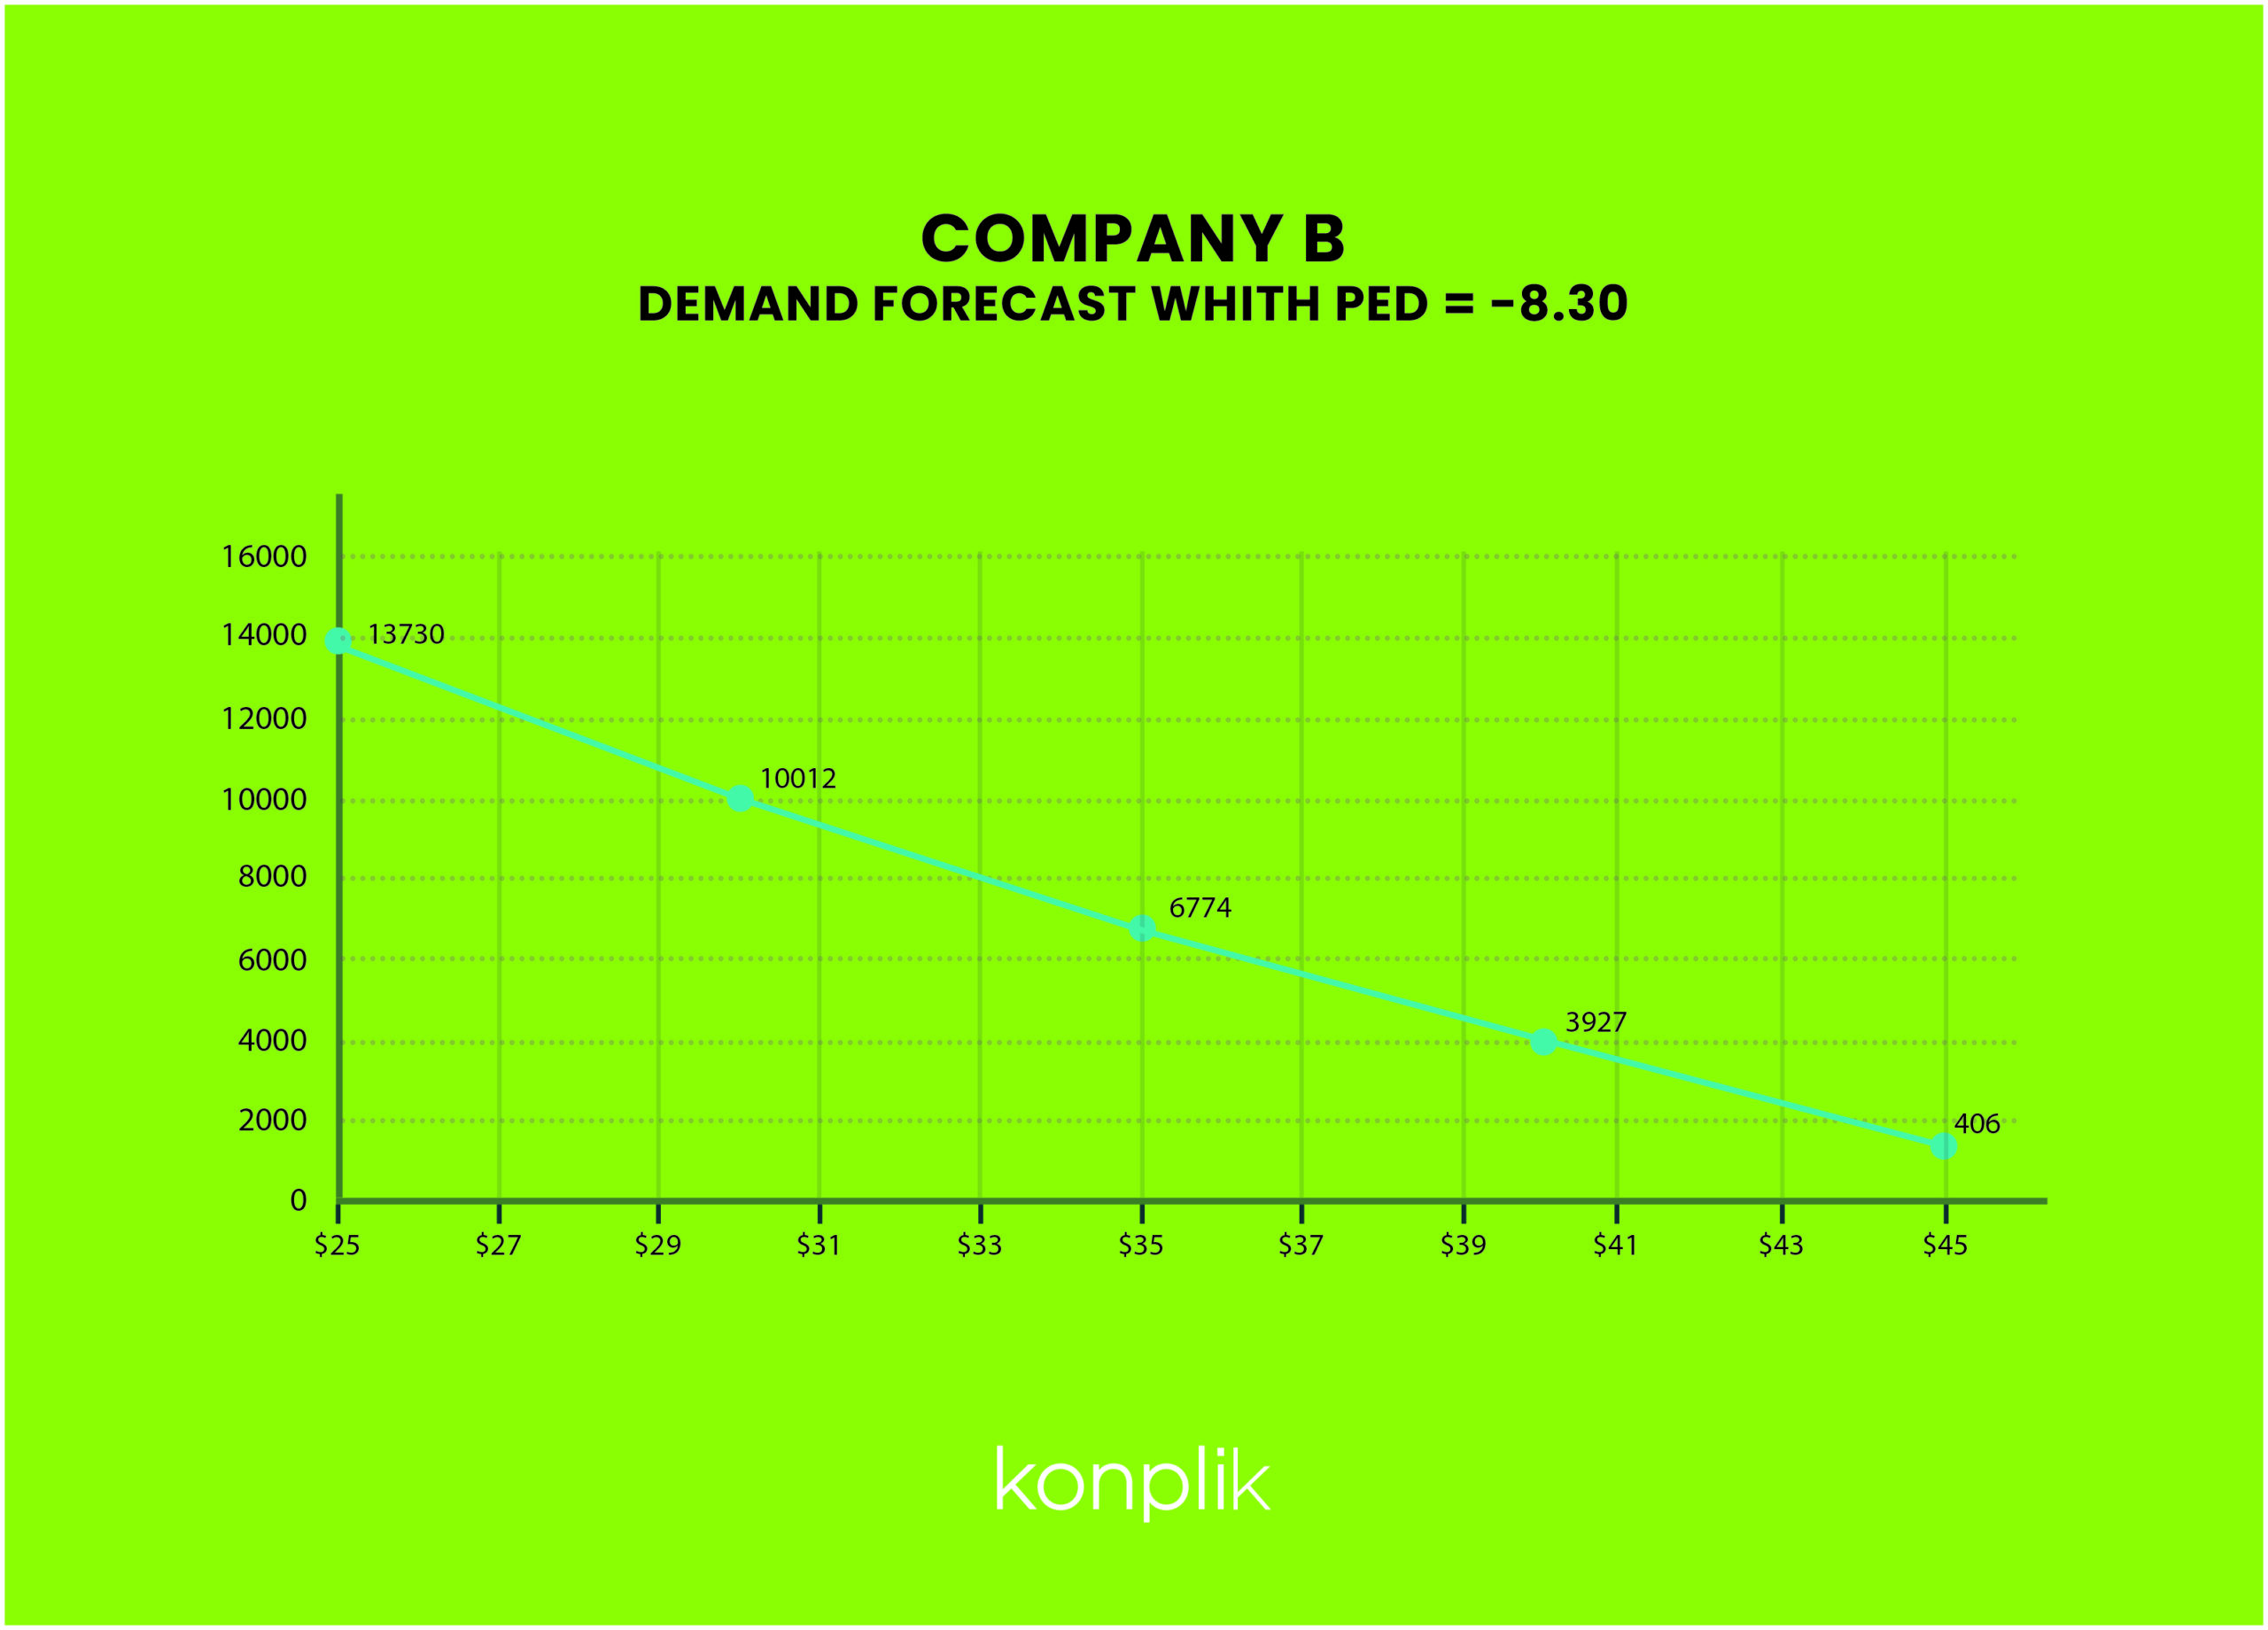
Predicting quantities when we know the P.E.D
In keeping with the example of the life-saving drug, we already know the PED (- 0.12). What would happen to our demand if, instead of 150 we raise the price with other quantities. Or rather, what if we dropped the price?
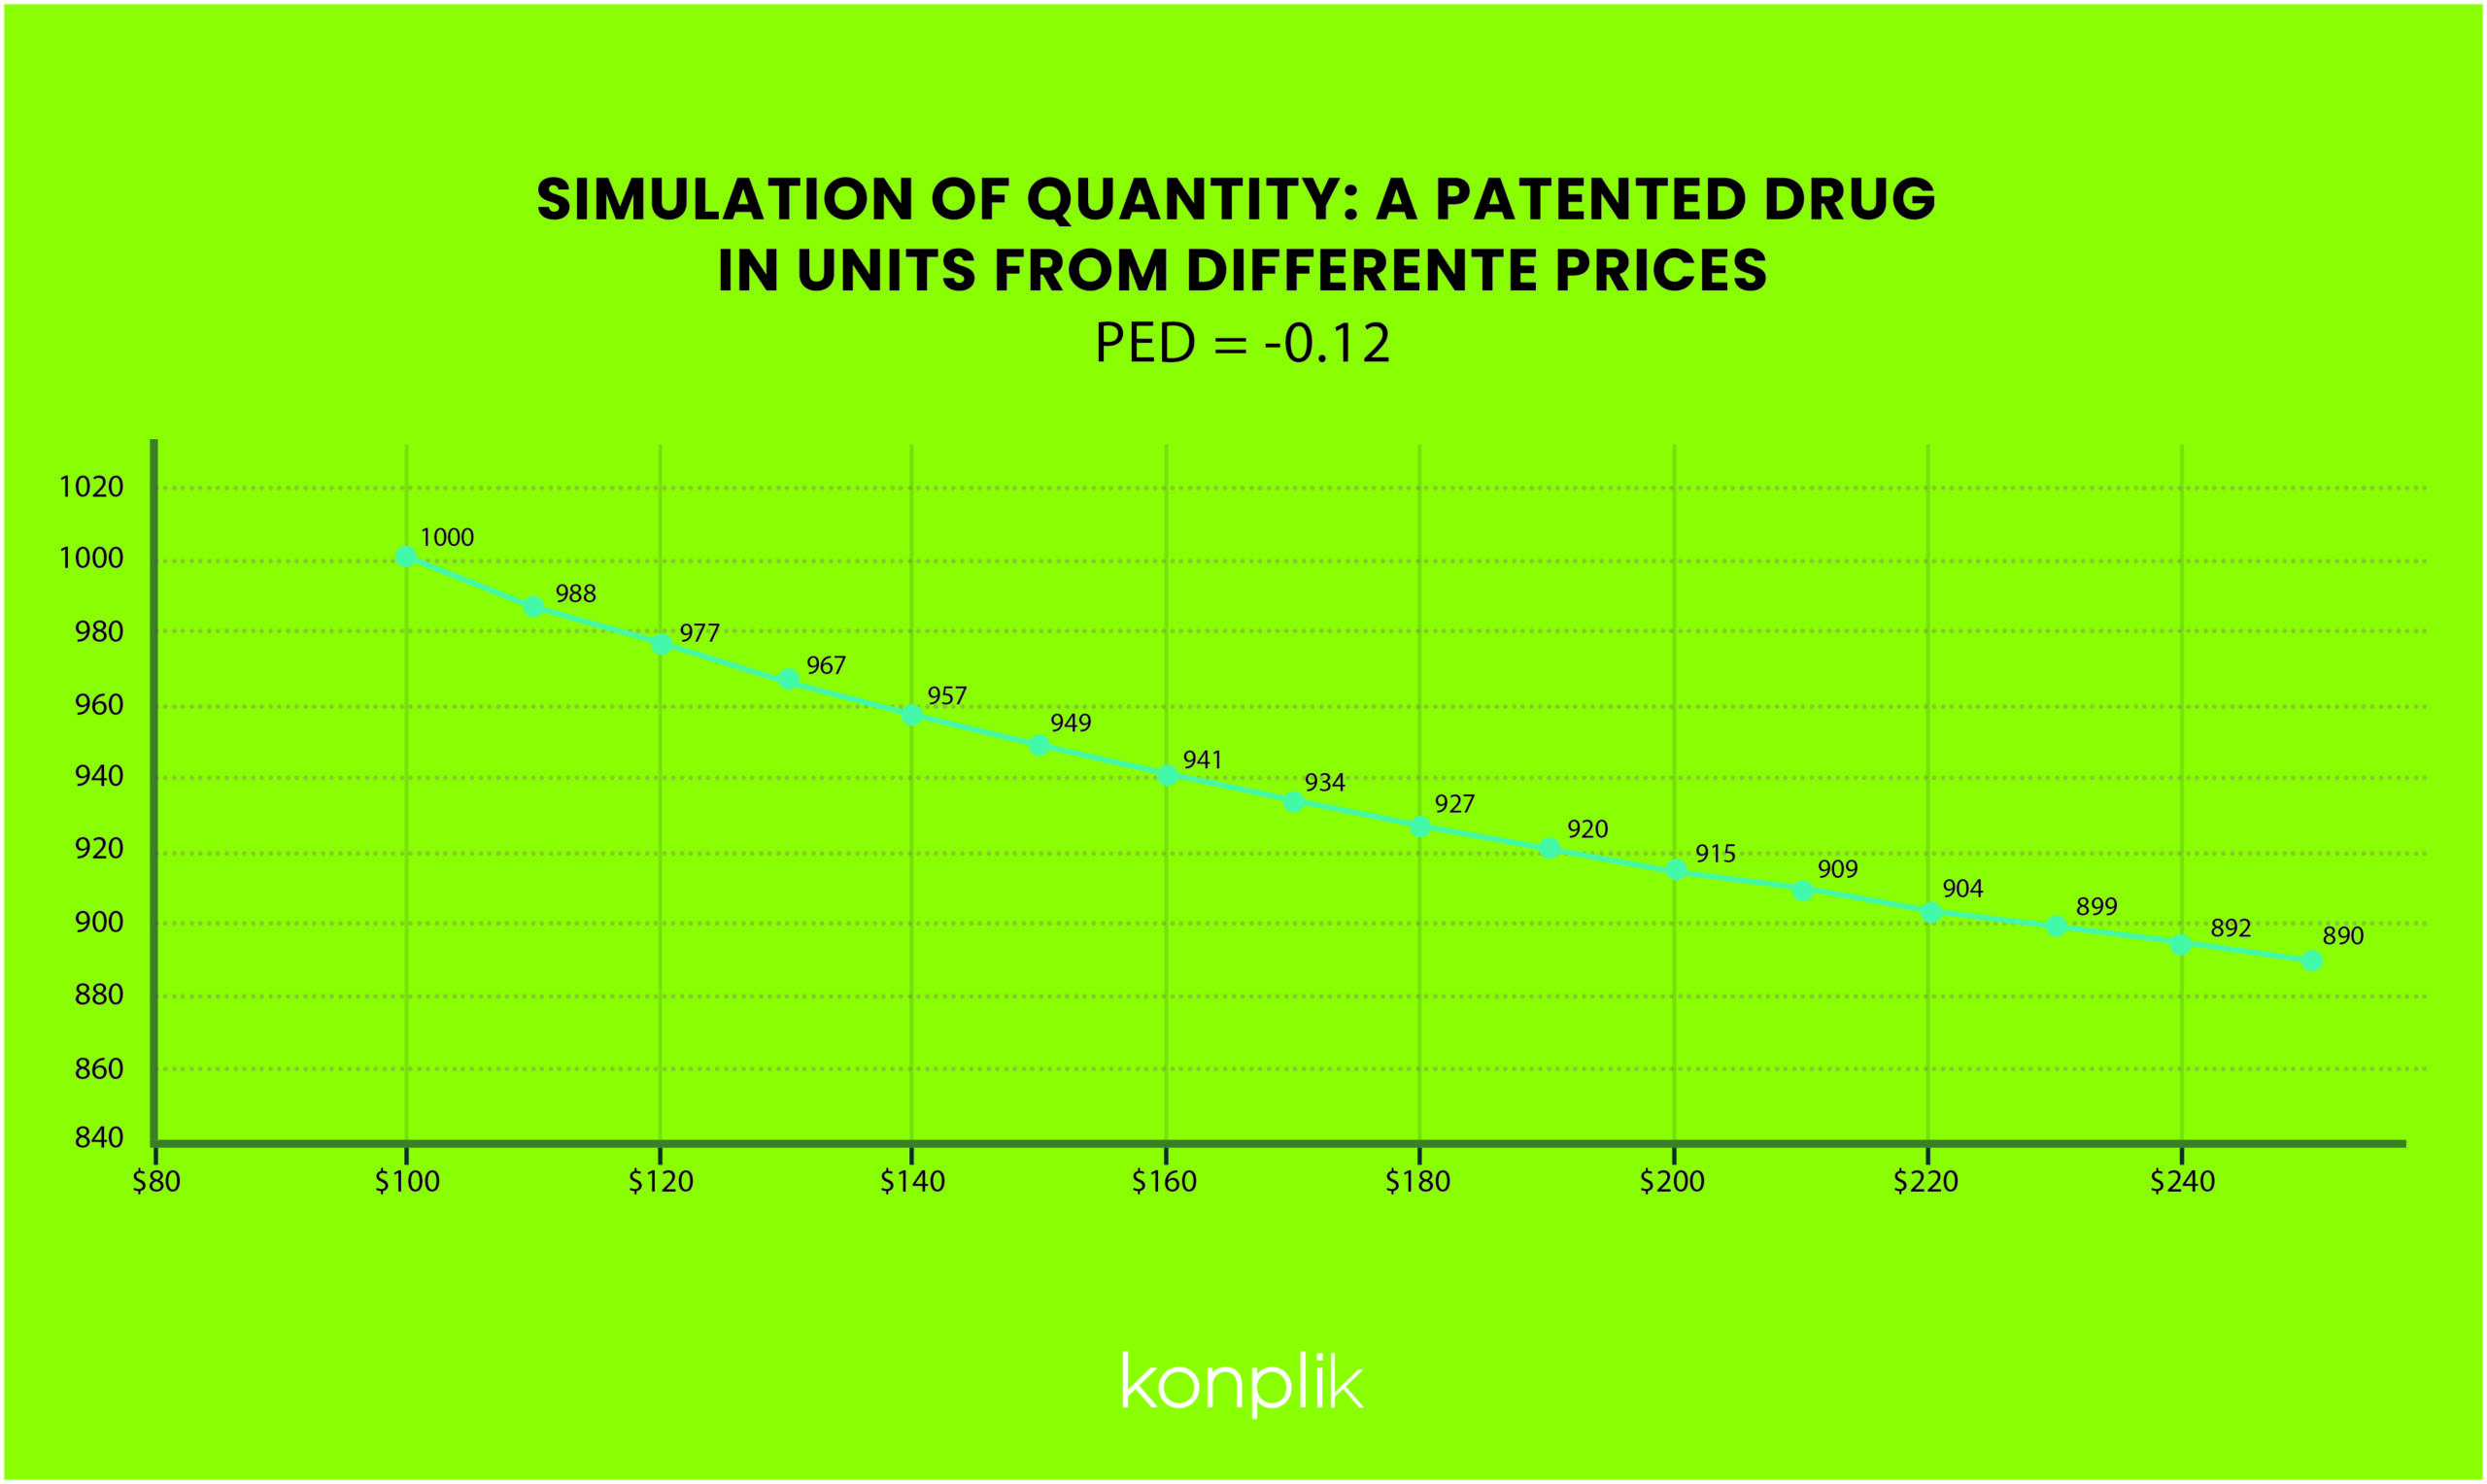
From perfectly inelastic to perfectly elastic
Conventionally, demand for a product is relatively elastic when its elasticity coeffcient is greater than one and is relatively inelastic when its coeffcient is less than one. The most common labels are:
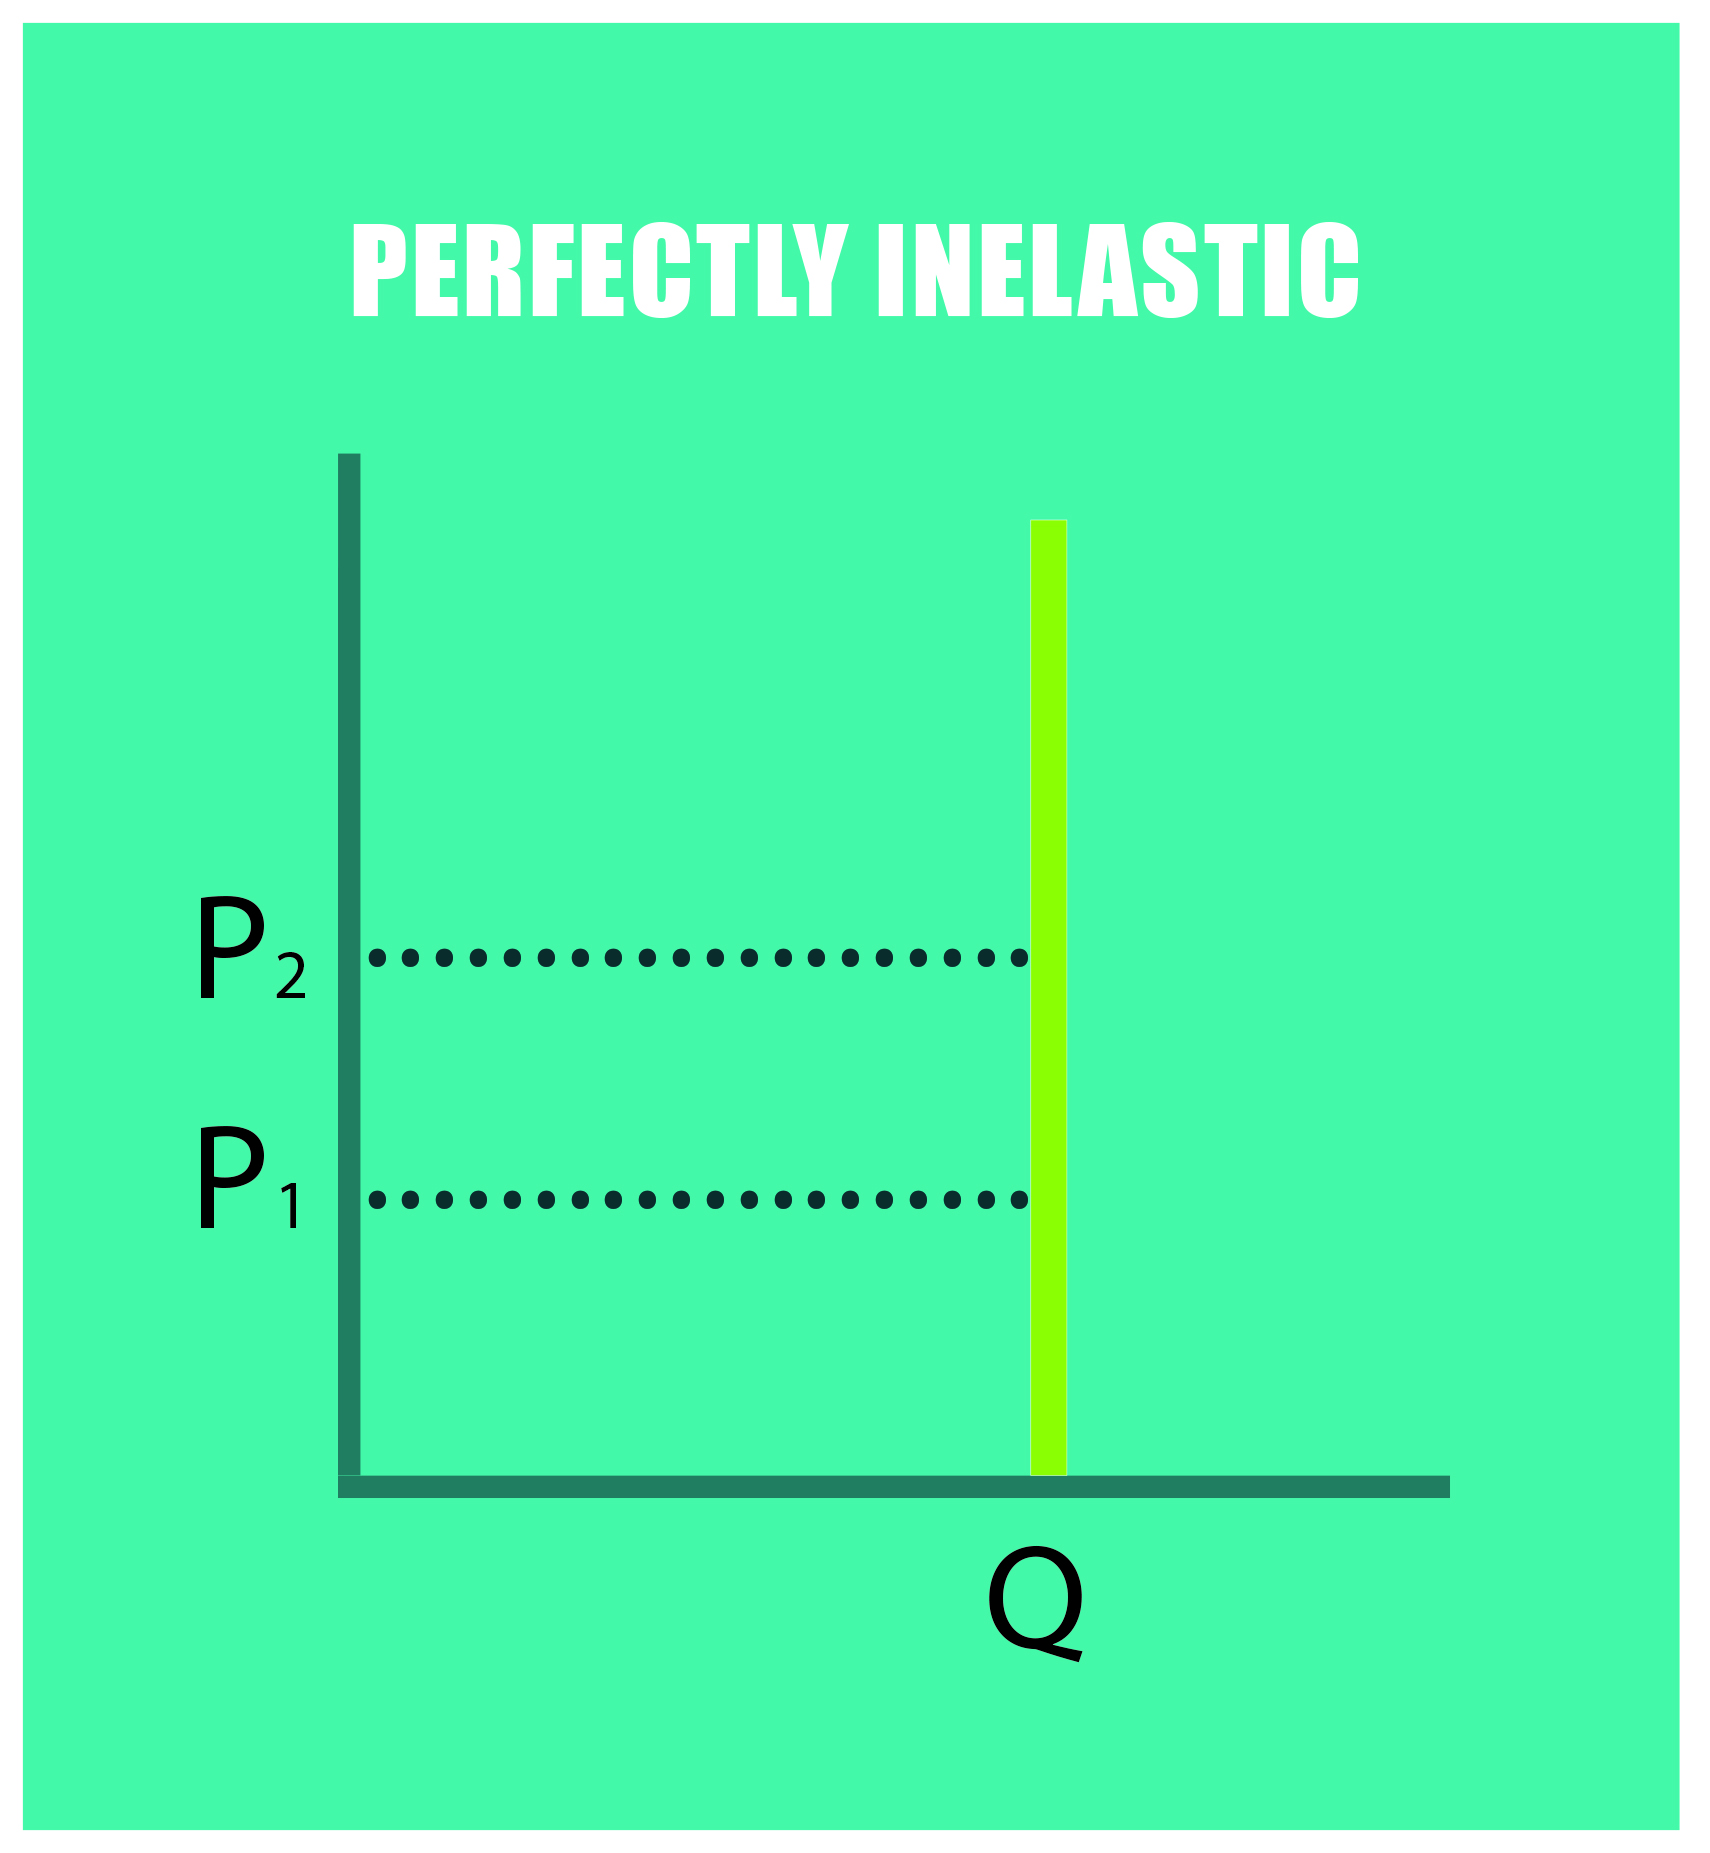
- Perfectly inelastic (E = 0): changes in the price do not affect the quantity demanded; raising prices will always cause total revenue to increase.
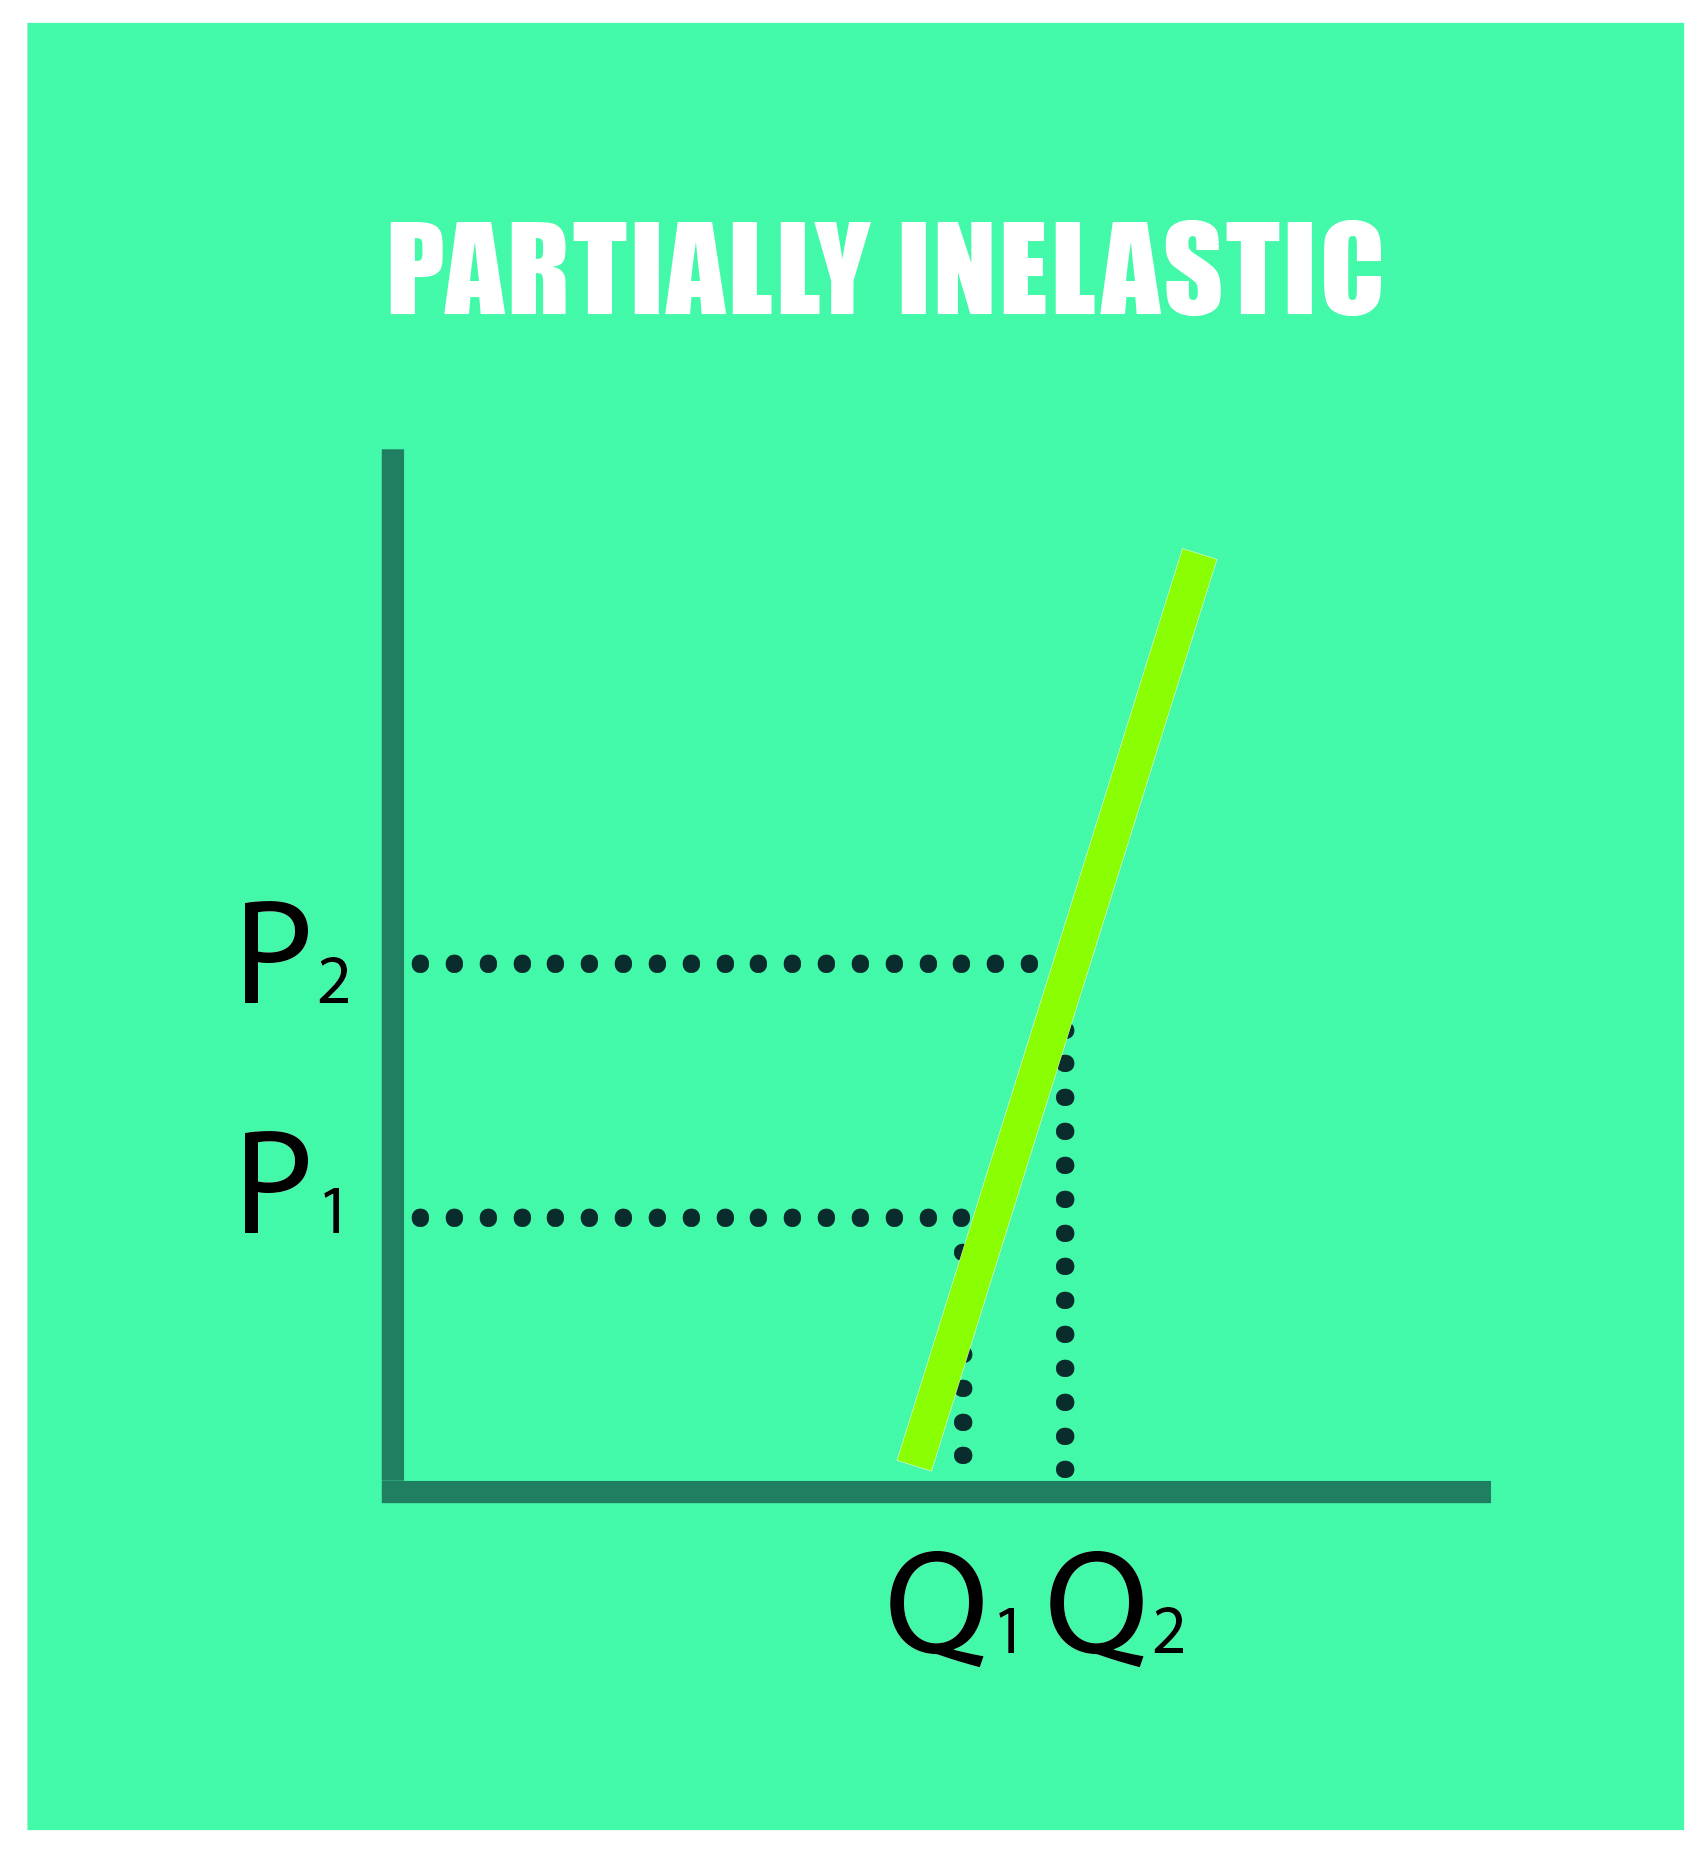
- Partially inelastic (0>E< -1) : the percentage change in quantity demanded is smaller than that in price. When the price rises, the total revenue increases.
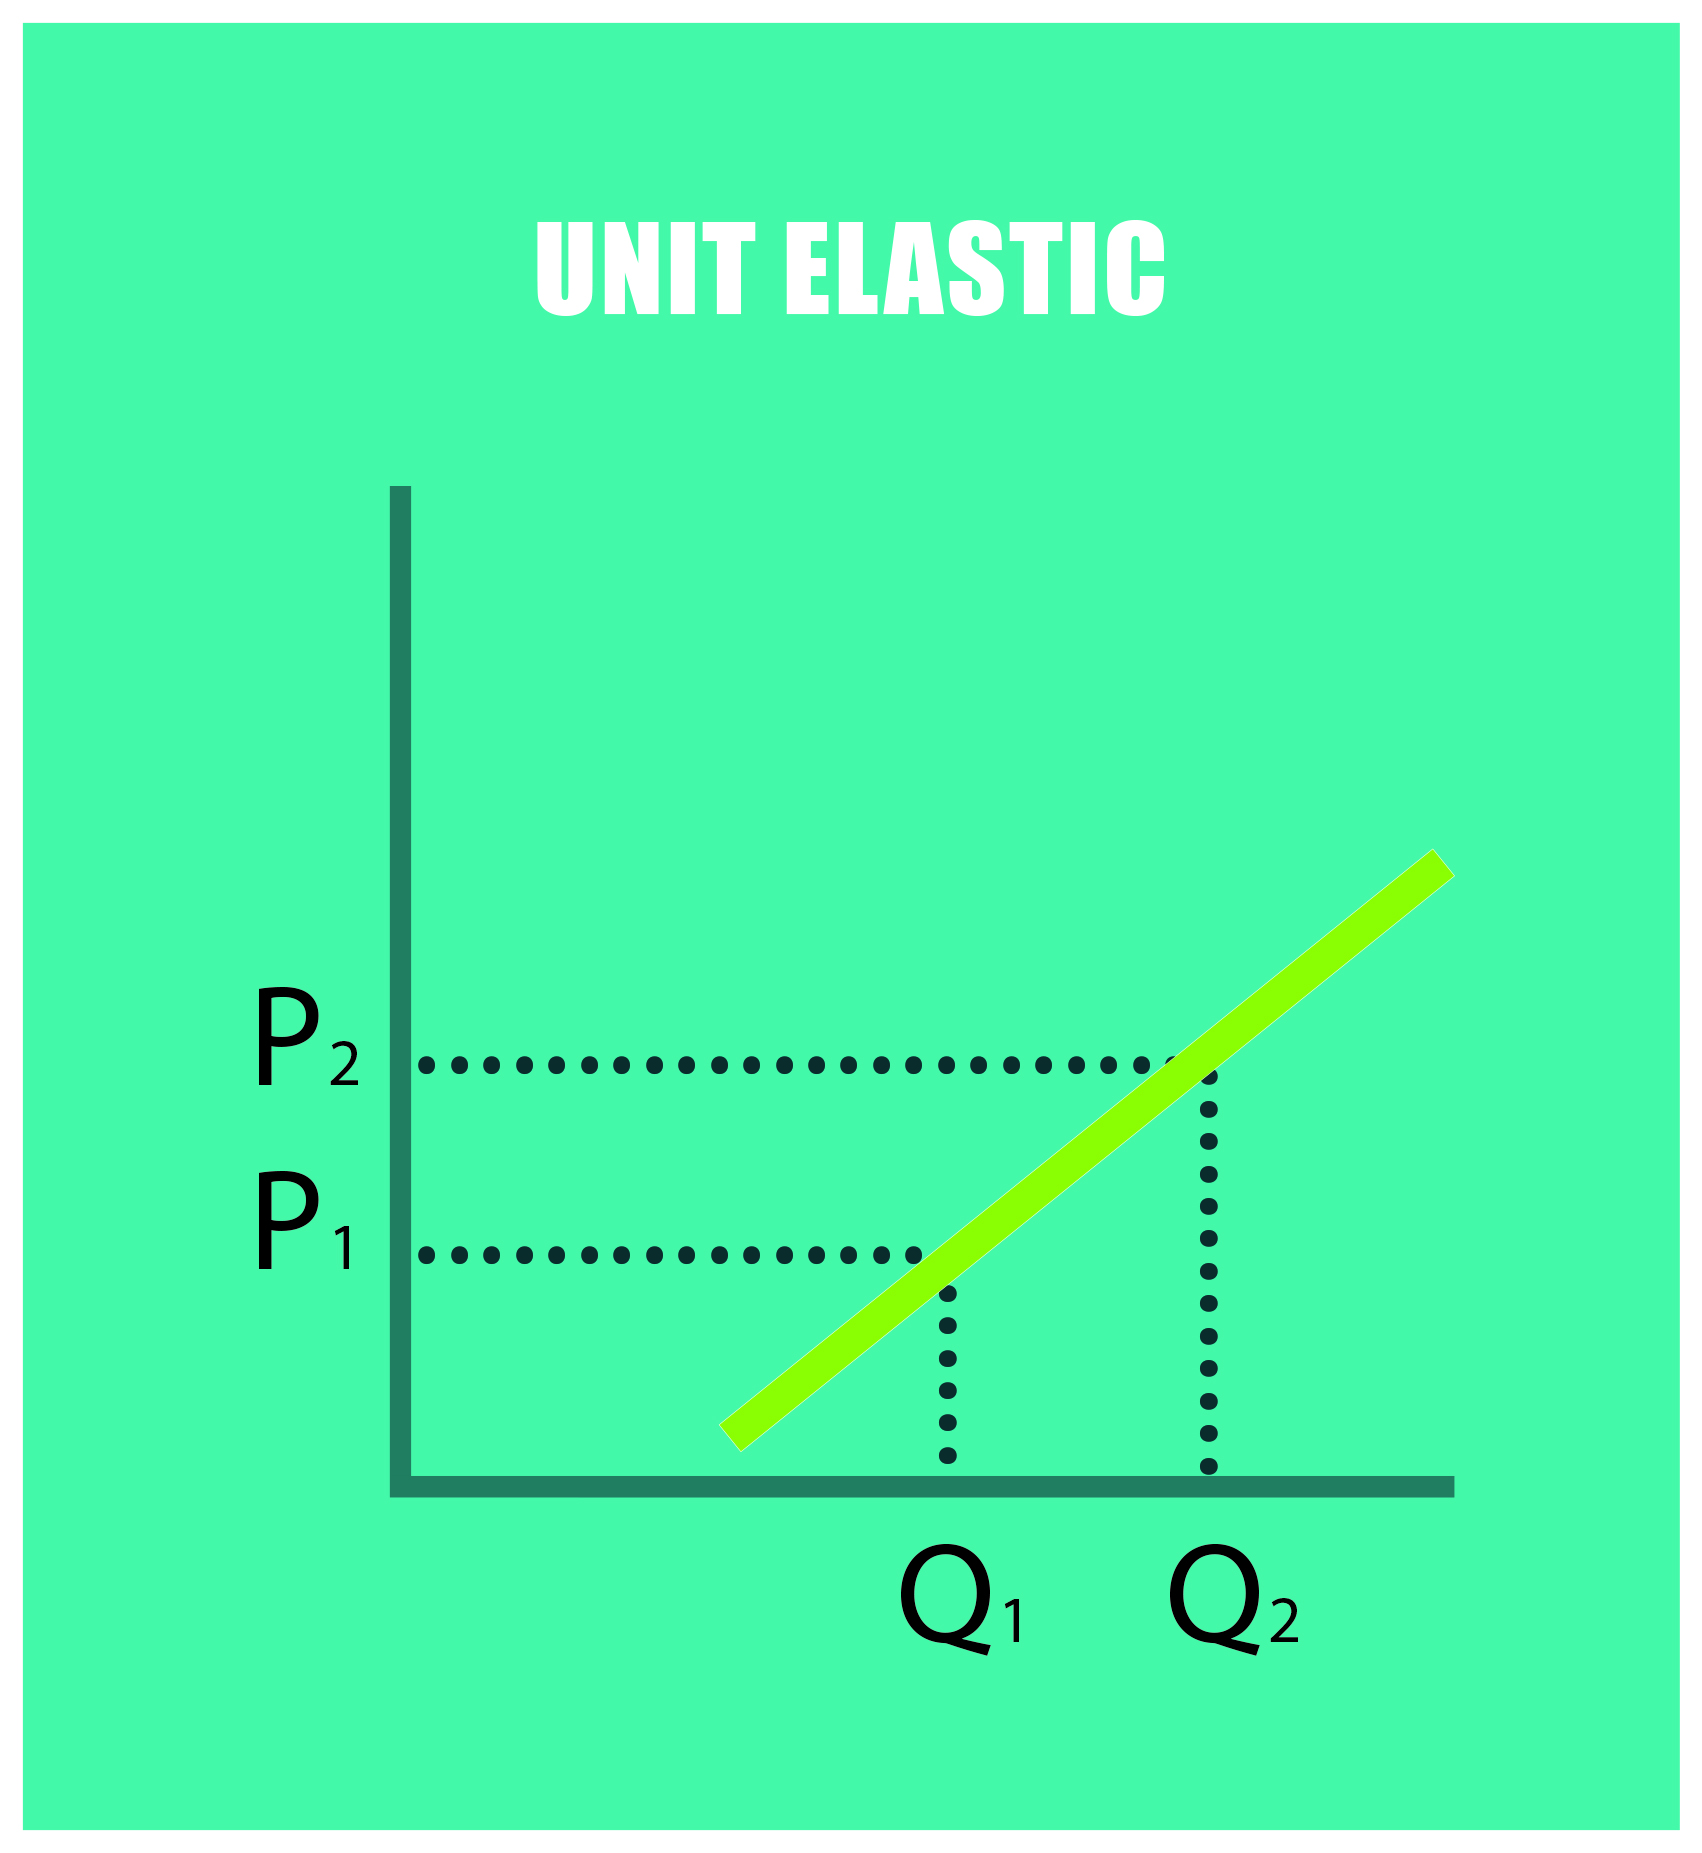
- Unit elastic (E = -1): the percentage of change in quantity demanded is equal to that in price. No change in price will affect revenue.
- Partially elastic (-∞> E < -1): the percentage of change in quantity demanded is more significant than that in price. When the price rises, the total revenue falls.

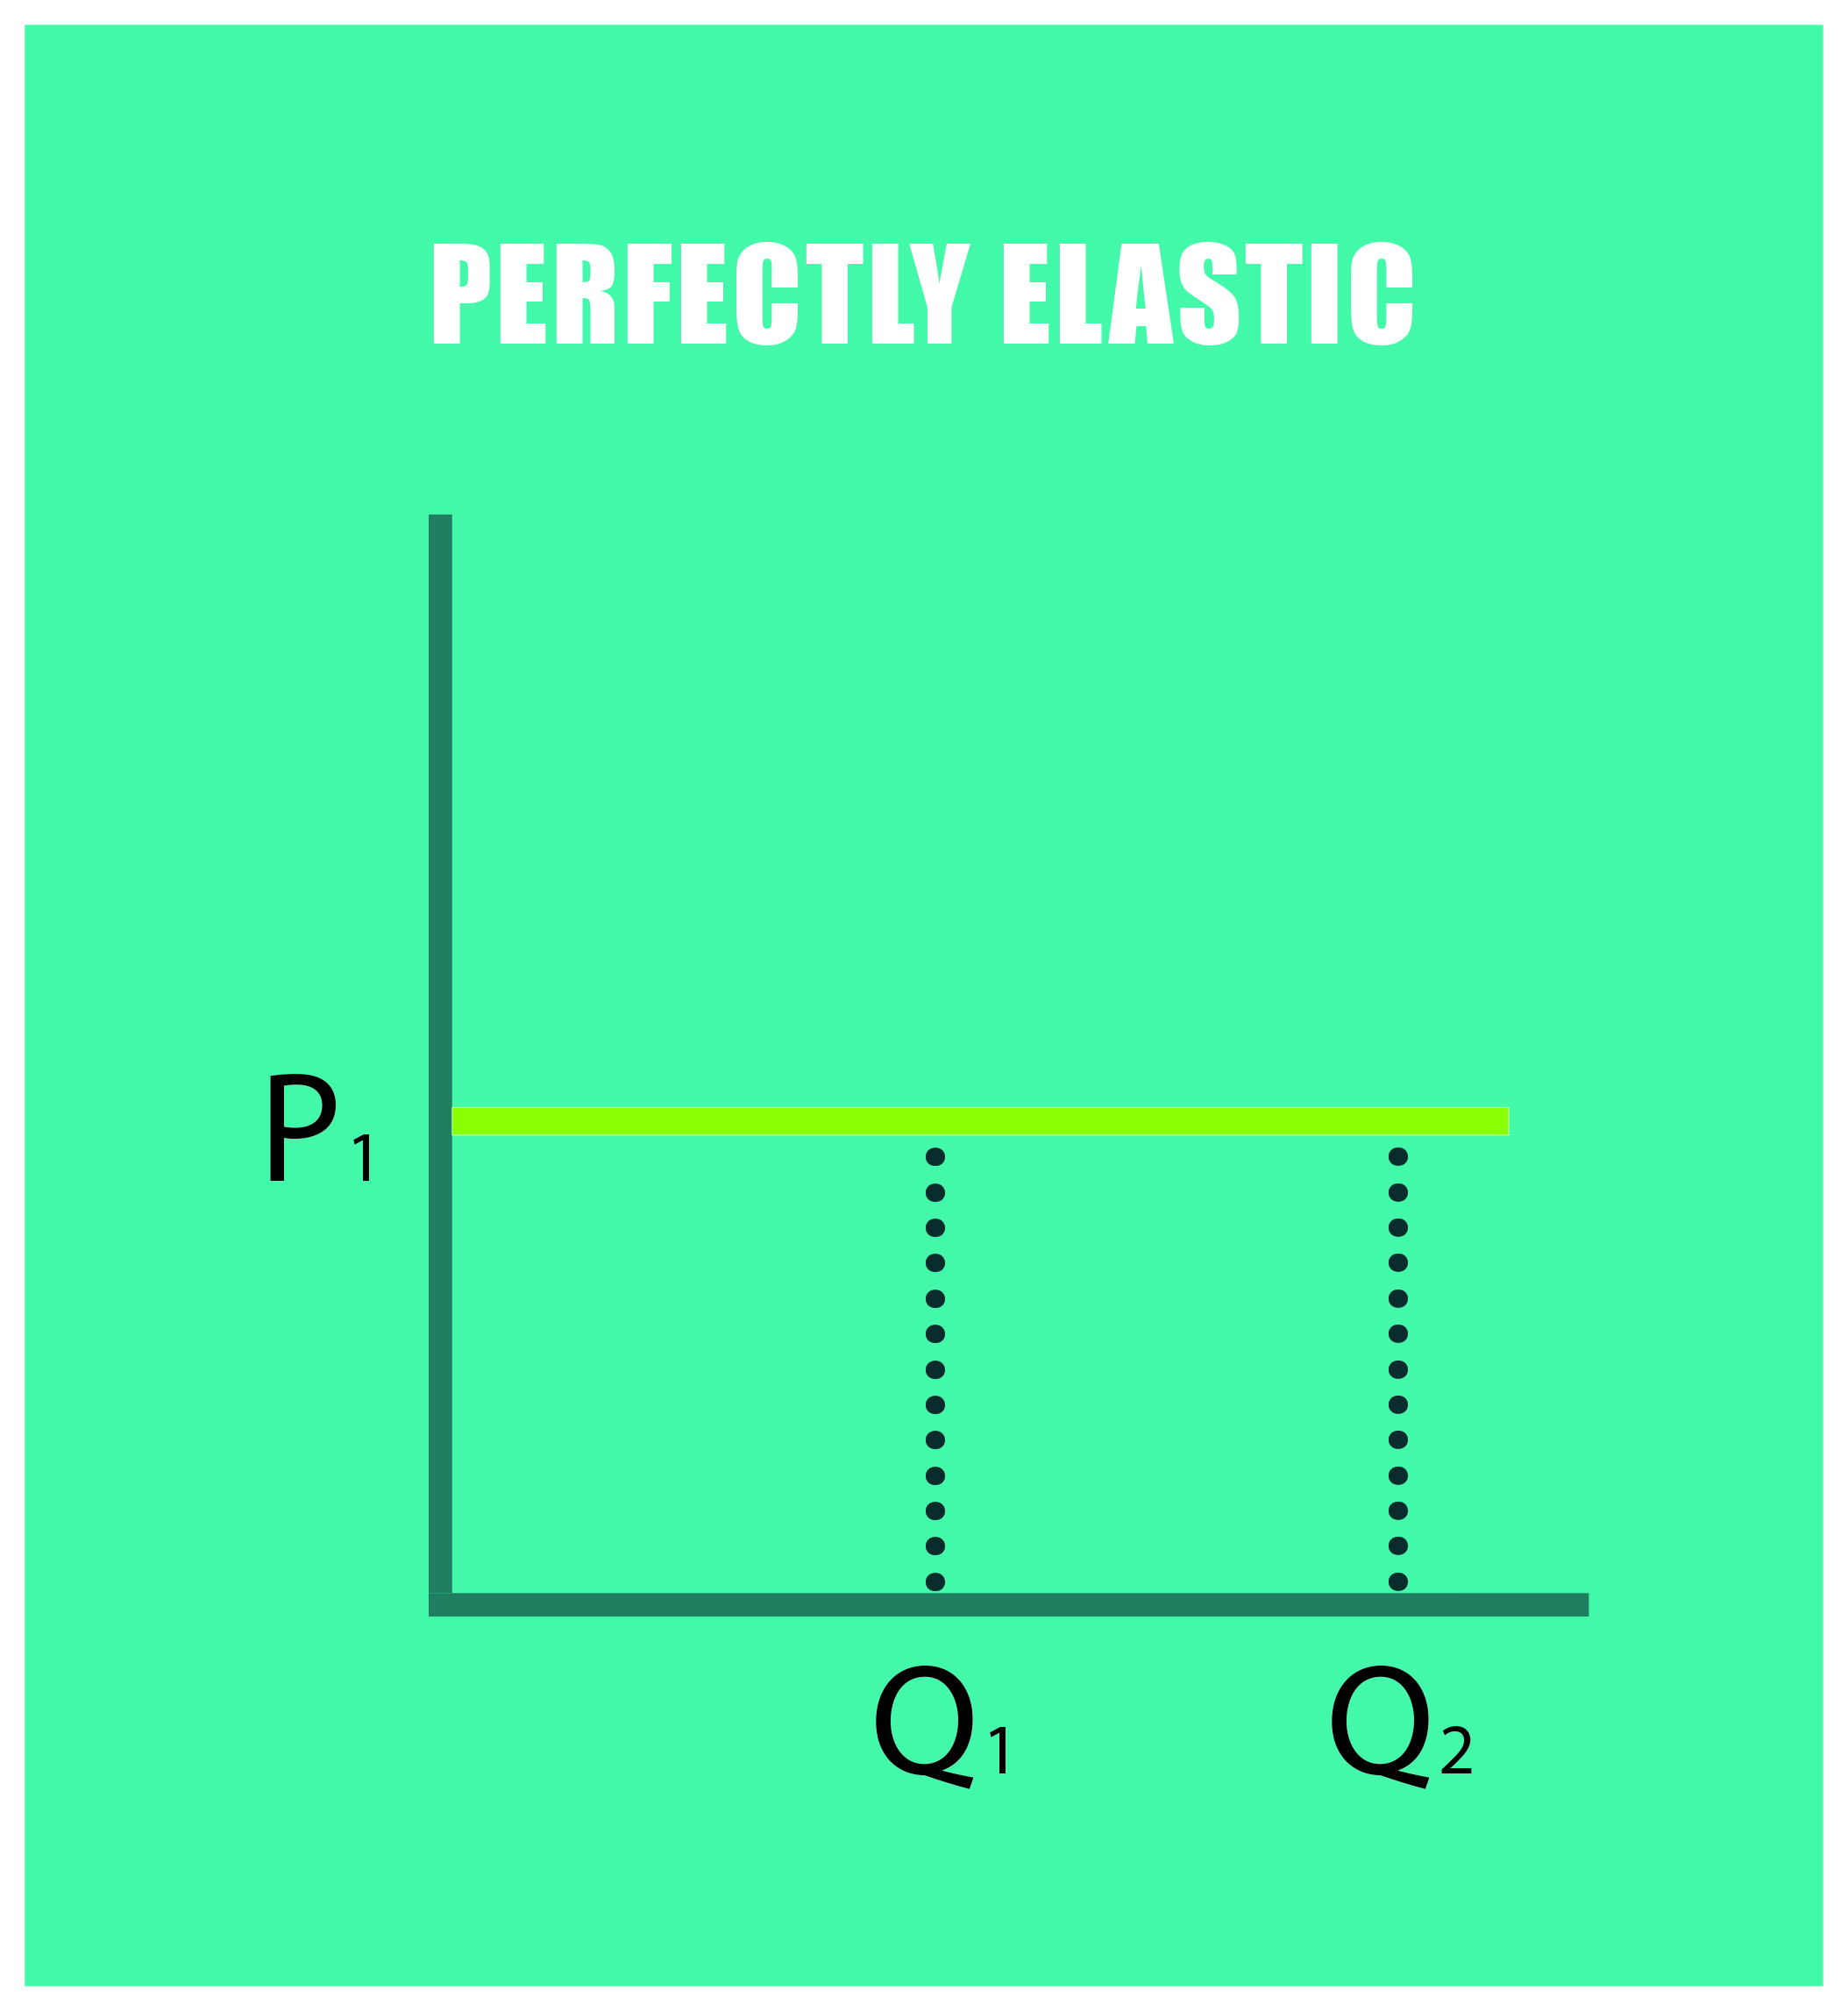
- Perfectly elastic (E = -∞): any percentage of increase in the price will cause the demand to drop to zero. When the price rises, the total revenue falls to zero.
Two real examples from the US market
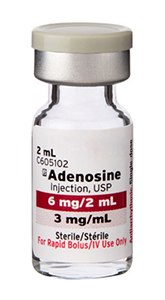
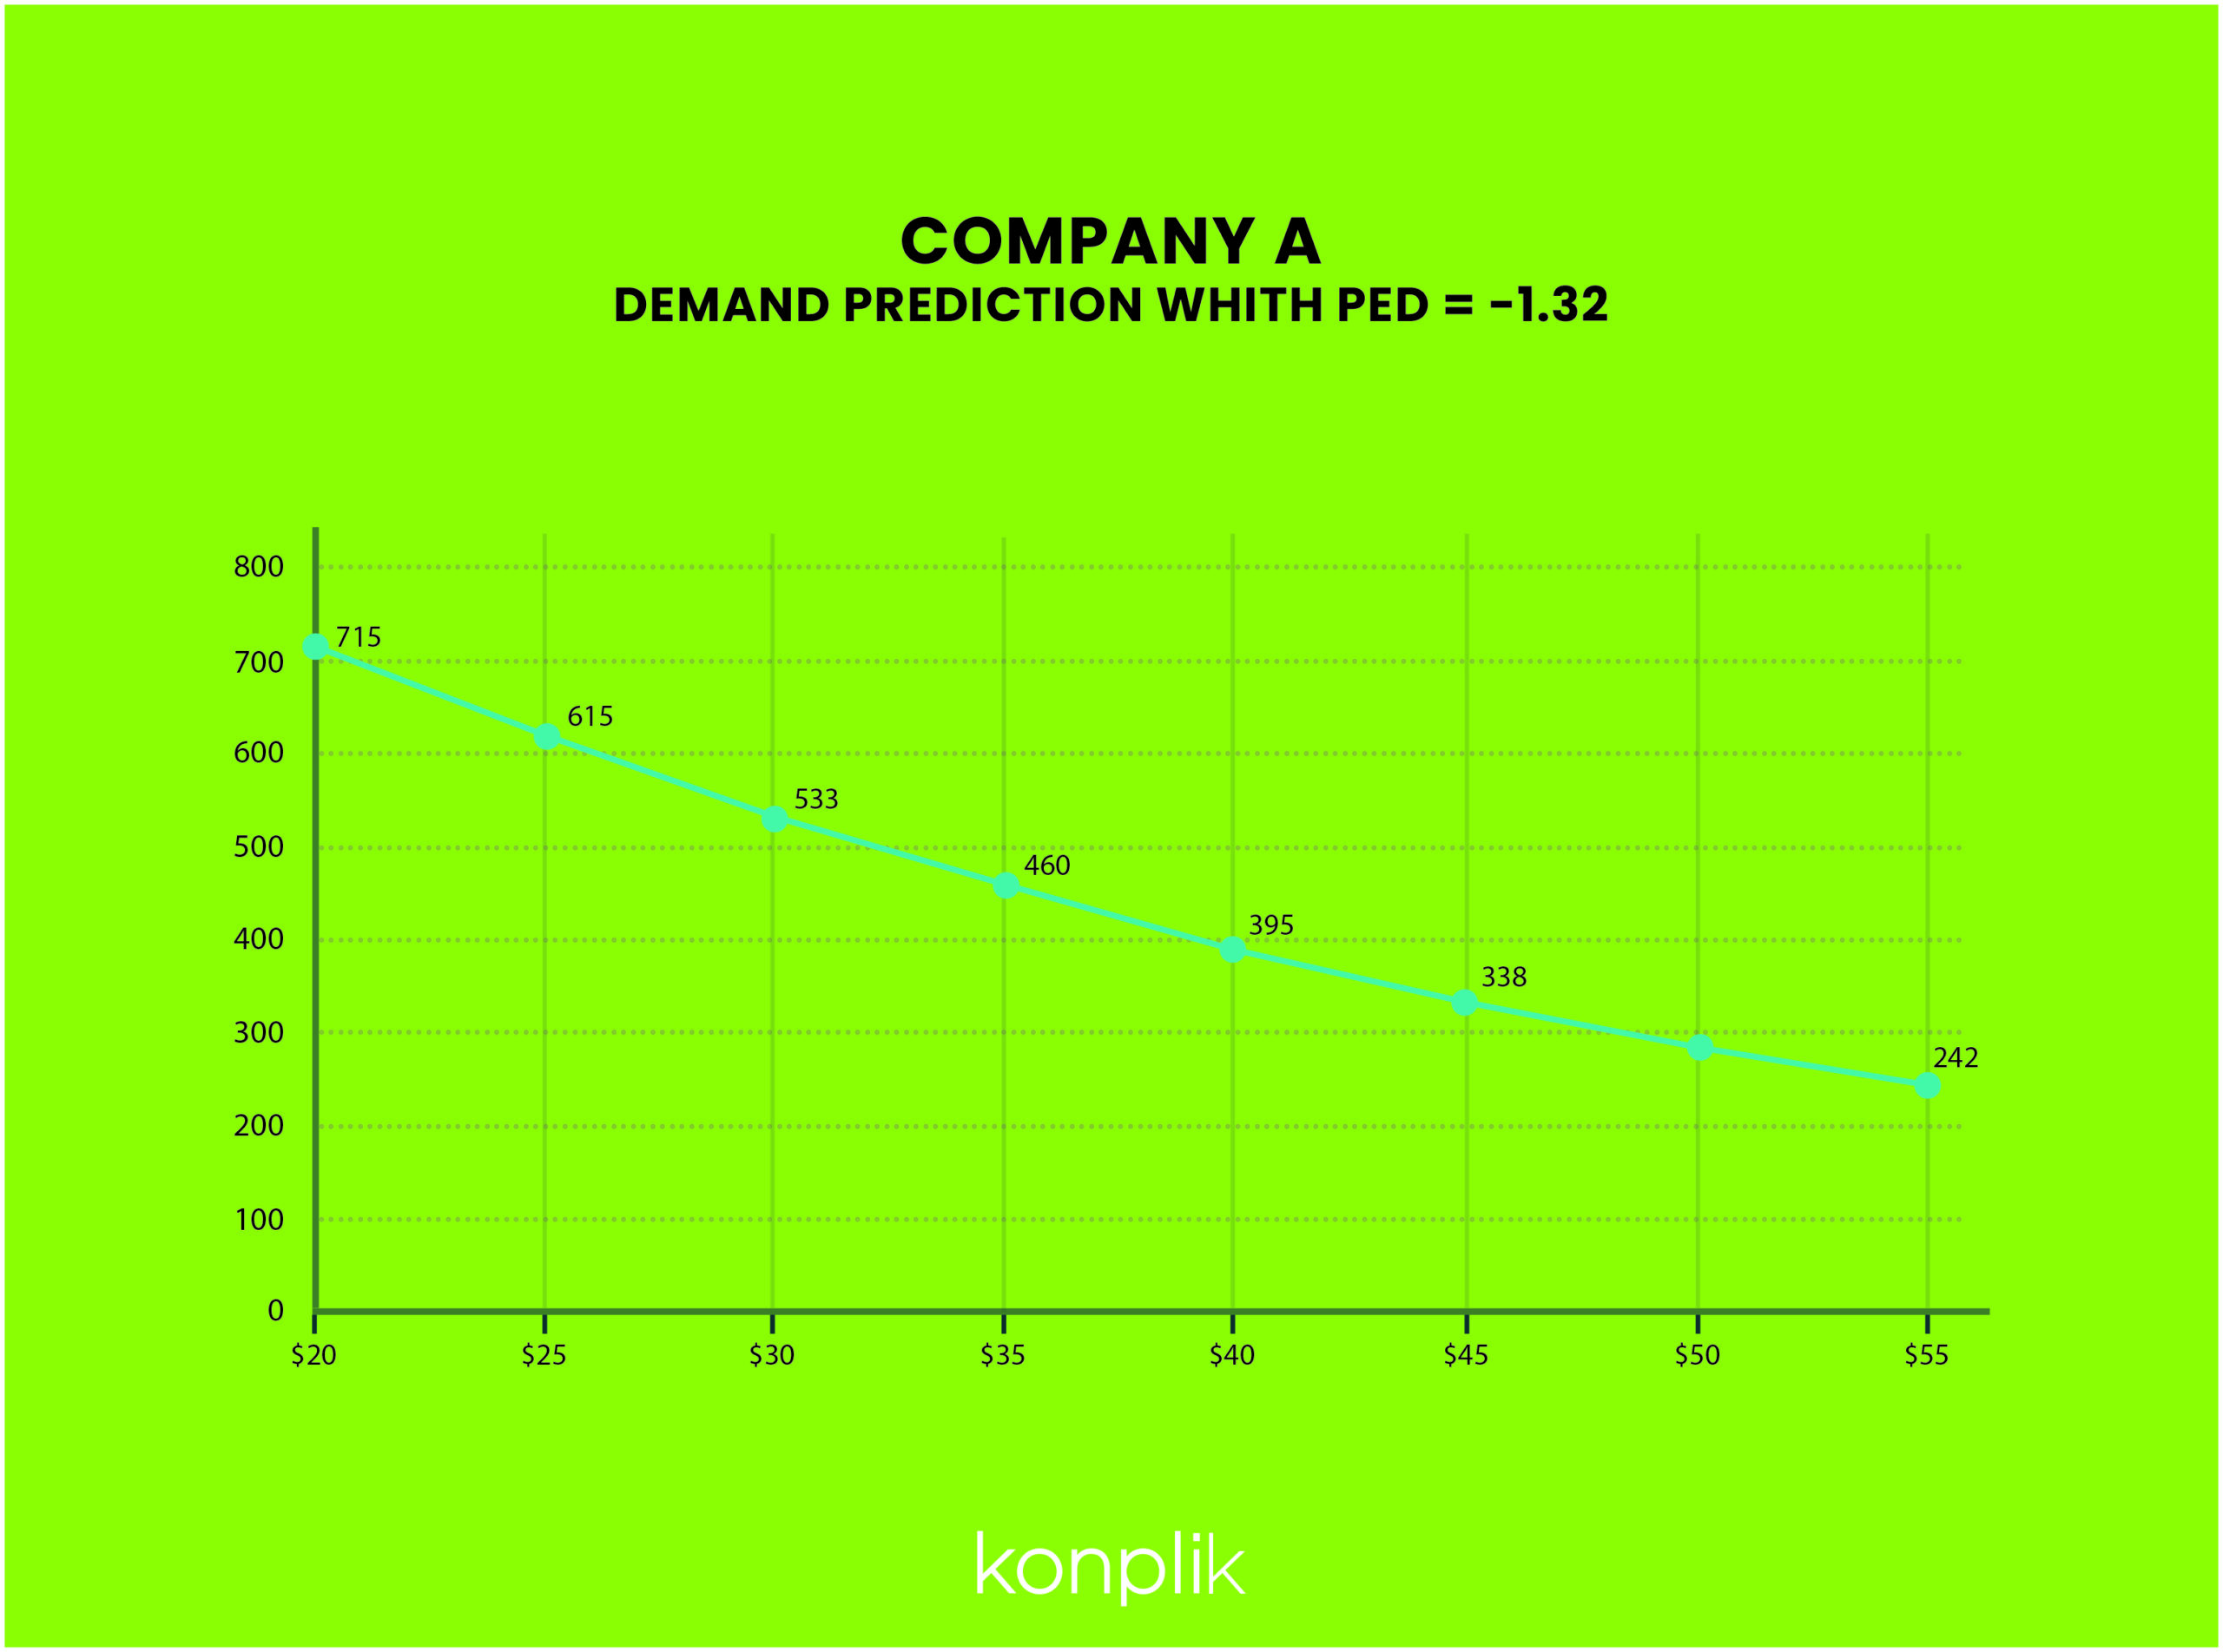
Company A. PED for ADENOSINE- 3MG/ML. VIAL US MARKET.
Adenosine-3mg/ml-vial has as many as 7 products by competing manufacturers that are registered as therapeutic equivalents.
Price Elasticity can be affected by shortages (we discuss this issue in the next post in the series on PED). To avoid the effect shortages have on price, we have chosen Adenosine-3mg/ml, because no product in their group of therapeutic equivalents suffered any type of shortage in the last 12 months.
The product shows a high degree of price elasticity (1.32)
Adenosine-3mg/ml
Company A
P0 (Price April20) = $42.48
P1 (Price May20) = $27.18
Q0 (Quantity April20 = 366 units
Q1 (Quantity April20) = 666 units
PED = – 1.32
Company B. PED for ADENOSINE- 3MG/ML. VIAL US MARKET
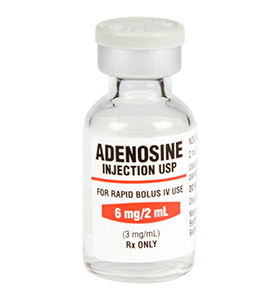
This is another example taken from the US market. The molecule and presentation of this product is identical to that of the example above, and thus competes in the same group. On this occasion, it is Company B’s product and the prices correspond to May-20 and June-20.
It appears Company B, which was the leader in the group with a market share above 30%, decided to react to the discount Company A offered the previous month.
Company B’s product shows a much higher degree of price elasticity (- 8.30).
Adenosine-3mg/ml-by company B
P0 (Price May20) = $42.60
P1 (Price June20) = $39.59
Q0 (Quantity May20 = 2,579 units
Q1 (Quantity June20) = 4,833 units
PED = – 8.30
This is the second in a series of three posts with the following topics about price elasticity:
1. Price Elasticity in Pharma: introduction
2. Calculating the price elasticity and predicting demand with examples from pharma
3. Demand Beyond a Medicine’s Price: Cross Elasticity of Demand
In the next post, you can learn how to calculate cross-price elasticity of demand, with other scenarios where drug price variations impact competing products.


Recent Comments